Performance monitoring in Java Full Stack applications involves tracking and analyzing various metrics to ensure optimal performance and identify areas for improvement. It helps you identify bottlenecks, optimize resource utilization, and deliver a seamless user experience. Here’s an introduction to performance monitoring in Java Full Stack applications:
- Performance Metrics to Monitor:
Track key performance indicators (KPIs) such as response time, throughput, error rates, CPU and memory usage, database queries, network latency, and system resource utilization. These metrics provide insights into the performance of your application and infrastructure. - Instrumentation and Logging:
Instrument your application code with logging statements to capture important events and performance-related information. Log relevant data such as method execution times, database query times, and any significant actions or exceptions. Logging frameworks like Logback or Log4j2 can help with this. - Profiling:
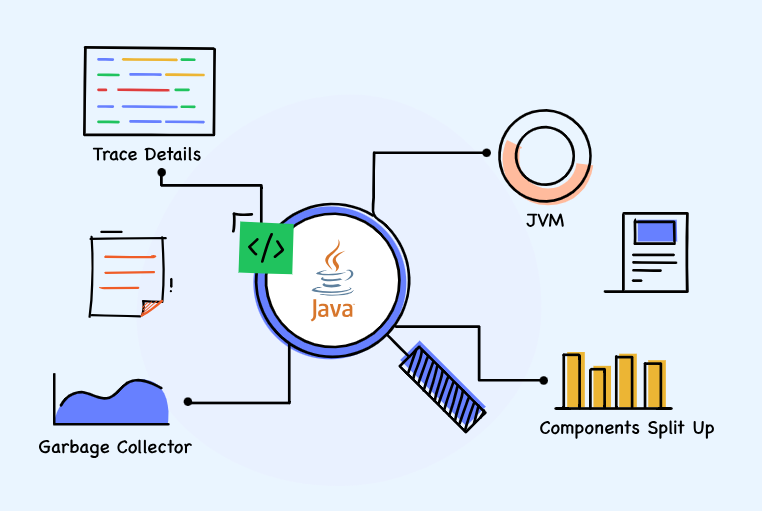
Use profiling tools to identify performance bottlenecks in your Java code. Profilers like Java Flight Recorder (JFR), VisualVM, or YourKit can capture detailed runtime information such as method-level timings, CPU and memory usage, and thread activity. Analyze the profiler data to identify hotspots and areas for optimization. - Application Monitoring:
Utilize application monitoring tools to gain visibility into your application’s performance. These tools can track response times, error rates, and resource usage in real-time. Popular options include New Relic, Datadog, and AppDynamics. Configure alerts to notify you when performance thresholds are exceeded. - Distributed Tracing:
Implement distributed tracing to gain insights into the end-to-end performance of requests as they traverse your application’s microservices or components. Tools like OpenTelemetry, Zipkin, or Jaeger can help capture and analyze the flow of requests across your system, identifying latency and bottlenecks. - APM Integration:
Integrate with Application Performance Monitoring (APM) solutions to gain comprehensive insights into your application’s performance. APM tools like Dynatrace, Splunk, or Elastic APM provide real-time monitoring, advanced analytics, and automated performance diagnostics. They offer features like transaction tracing, code-level insights, and deep database monitoring. - Load Testing and Performance Testing:
Conduct load testing and performance testing to simulate high user traffic and measure how your application performs under heavy load. Tools like Apache JMeter or Gatling can generate concurrent user requests and measure response times, throughput, and system behavior. Analyze the results to identify performance bottlenecks and optimize accordingly. - Continuous Performance Monitoring:
Integrate performance monitoring into your continuous integration and delivery (CI/CD) pipeline. Automatically run performance tests as part of your deployment process and use performance monitoring tools to monitor the application in production. This ensures that performance issues are identified early and proactively addressed. - Trend Analysis and Optimization:
Continuously analyze performance metrics over time to identify trends and patterns. Look for recurring issues, performance degradation, or spikes in resource utilization. Use this information to optimize your application code, database queries, caching strategies, and infrastructure configurations. - User Experience Monitoring:
Monitor user experience metrics such as page load times, transaction success rates, and user interactions. Real User Monitoring (RUM) tools like Google Analytics or Pingdom can help gather data on actual user experiences, allowing you to address usability and performance issues.
Performance monitoring is an ongoing process that requires continuous attention. By proactively monitoring and optimizing the performance of your Java Full Stack application, you can ensure a smooth and responsive user experience, improve efficiency, and mitigate potential issues before they impact your users.