1. Excel and Advanced Excel
Data cleaning, sorting, filtering, lookup formulas, pivot tables, charts, dashboard layouts, MIS reporting and practical assignments.
Offline classroom training in Jaipur
Guided 6-month classroom track with projects, reporting practice, interview preparation and career-focused support.
Learn Excel, SQL, Power BI, Tableau, Python basics and statistics through live training, practical assignments and 100% job assistance.
Course outcome
Data Analytics is useful for MIS, business analyst, reporting analyst, operations, finance, sales and entry-level data roles. This course is built around practical tools used in offices and analytics teams.
Graduates, commerce students, engineers, working professionals, MIS executives, Excel users and business owners who want practical analytics skills.
Main focus: offline classroom training in Jaipur. Online support is available for learners who need flexibility.
Program snapshot
Duration, project count and batch format can vary by batch. Please confirm current details with the counselling team before enrolling.
Get resume guidance, interview practice, project discussion points and profile support designed to help you become more job-ready.
Assignments, dashboards and case-study work help learners build confidence with practical tasks similar to workplace reporting and analyst routines.
If fee flexibility matters, ask the counselling team about current EMI options, batch structure and payment guidance.
Program snapshot
Duration, project count and batch format can vary by batch. Please confirm current details with the counselling team before enrolling.
Alumni proof
The old Seldom landing page highlighted alumni working with well-known companies. We are presenting this as trust context, not as a hiring guarantee.
Course outline
A more complete outline inspired by your older landing page, structured for a cleaner modern landing page.
Data cleaning, sorting, filtering, lookup formulas, pivot tables, charts, dashboard layouts, MIS reporting and practical assignments.
Database basics, SELECT queries, WHERE filters, joins, grouping, aggregate functions, subqueries and report-oriented query practice.
Power Query, data transformation, relationships, data modelling, DAX basics, KPI cards, slicers, interactive dashboards and report publishing concepts.
Python setup, variables, conditions, loops, functions, files, Pandas basics, data frames, cleaning datasets and basic analysis workflows.
Mean, median, mode, variance, standard deviation, correlation, probability basics, distributions and interpreting data for business decisions.
Choosing the right visual, chart formatting, KPI storytelling, executive summary thinking and presenting insights clearly.
Sales analysis, business performance dashboard, HR or operations dashboard, SQL reporting practice and a final case study for interview discussion.
Resume points, project explanation, interview questions, LinkedIn/profile guidance and 100% job assistance through practical support.
Projects
Projects make the course easier to understand and stronger for interviews. We should keep adding real project screenshots later, but the first version already explains the type of work learners will do.
Current fees, batch timing, duration, certificate details, trainer availability, online support and whether your background is suitable for this course.
Offline Jaipur classroom batches are the main format. Online support is available for learners who need flexibility around schedule or location.
Structured tool exposure, practical assignments, dashboard work, interview discussion points and resume-ready project material.
If you are comparing institutes, ask for current duration, fee structure, project support and trainer availability before deciding.
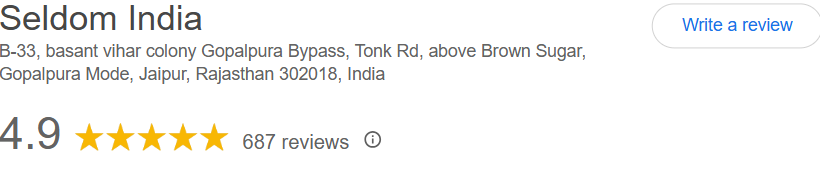
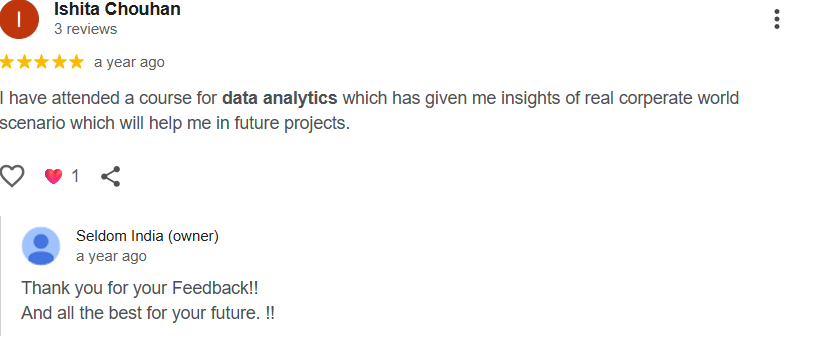
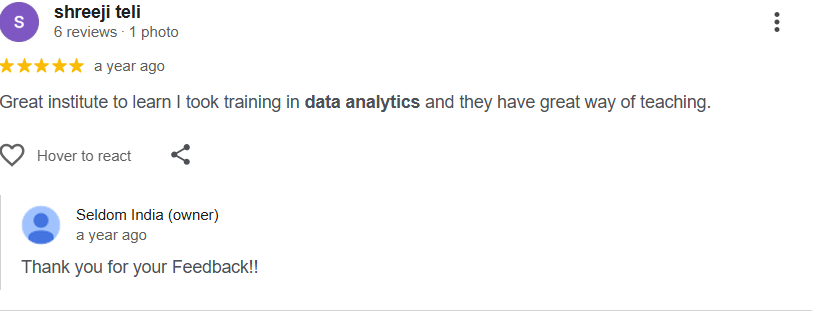
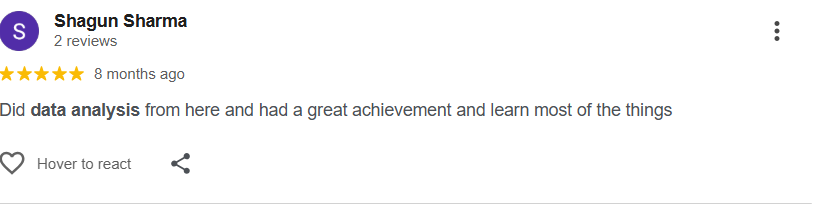
Learner proof
Real review screenshots from Seldom India's Google Business Profile, cropped to show only the useful review and rating information. Classroom visuals and additional proof can also be shared during counselling.
"I recently attended a Data Analytics workshop by Seldom India. It was a hands-on experience... working on live projects was truly beneficial."
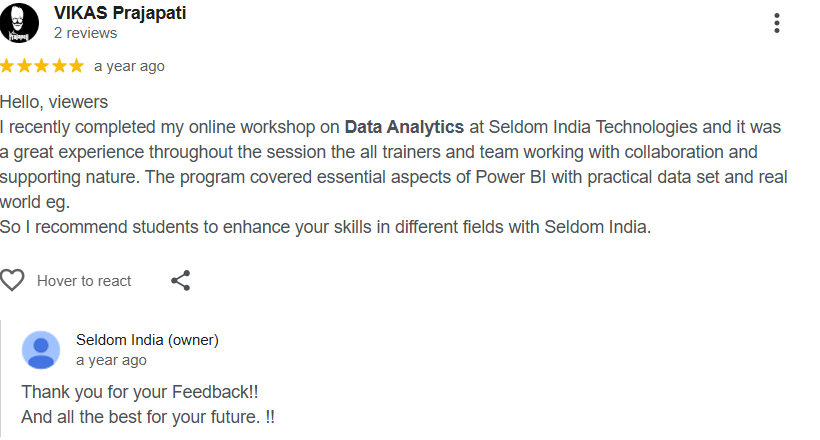
Divya JainGoogle review, Data Analytics workshop"I recently completed my online workshop on Data Analytics at Seldom India Technologies and it was a great experience throughout the session."
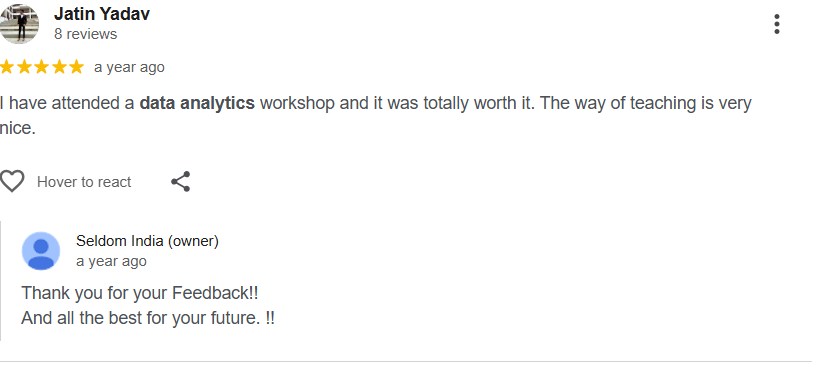
VIKAS PrajapatiGoogle review, Data Analytics workshop"I have attended a data analytics workshop and it was totally worth it. The way of teaching is very nice."
Jatin YadavGoogle review, Data Analytics workshop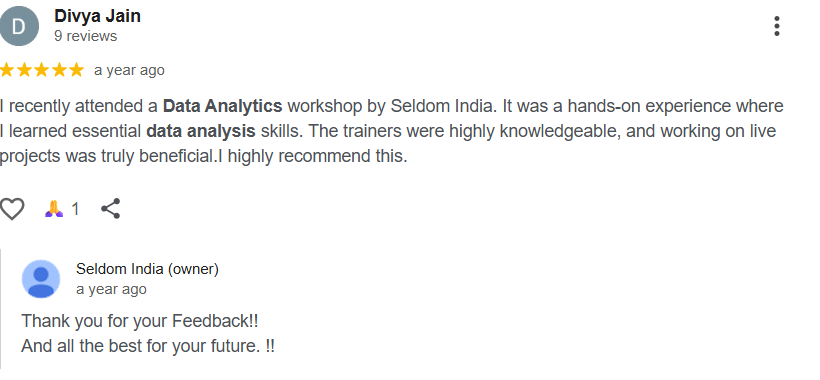
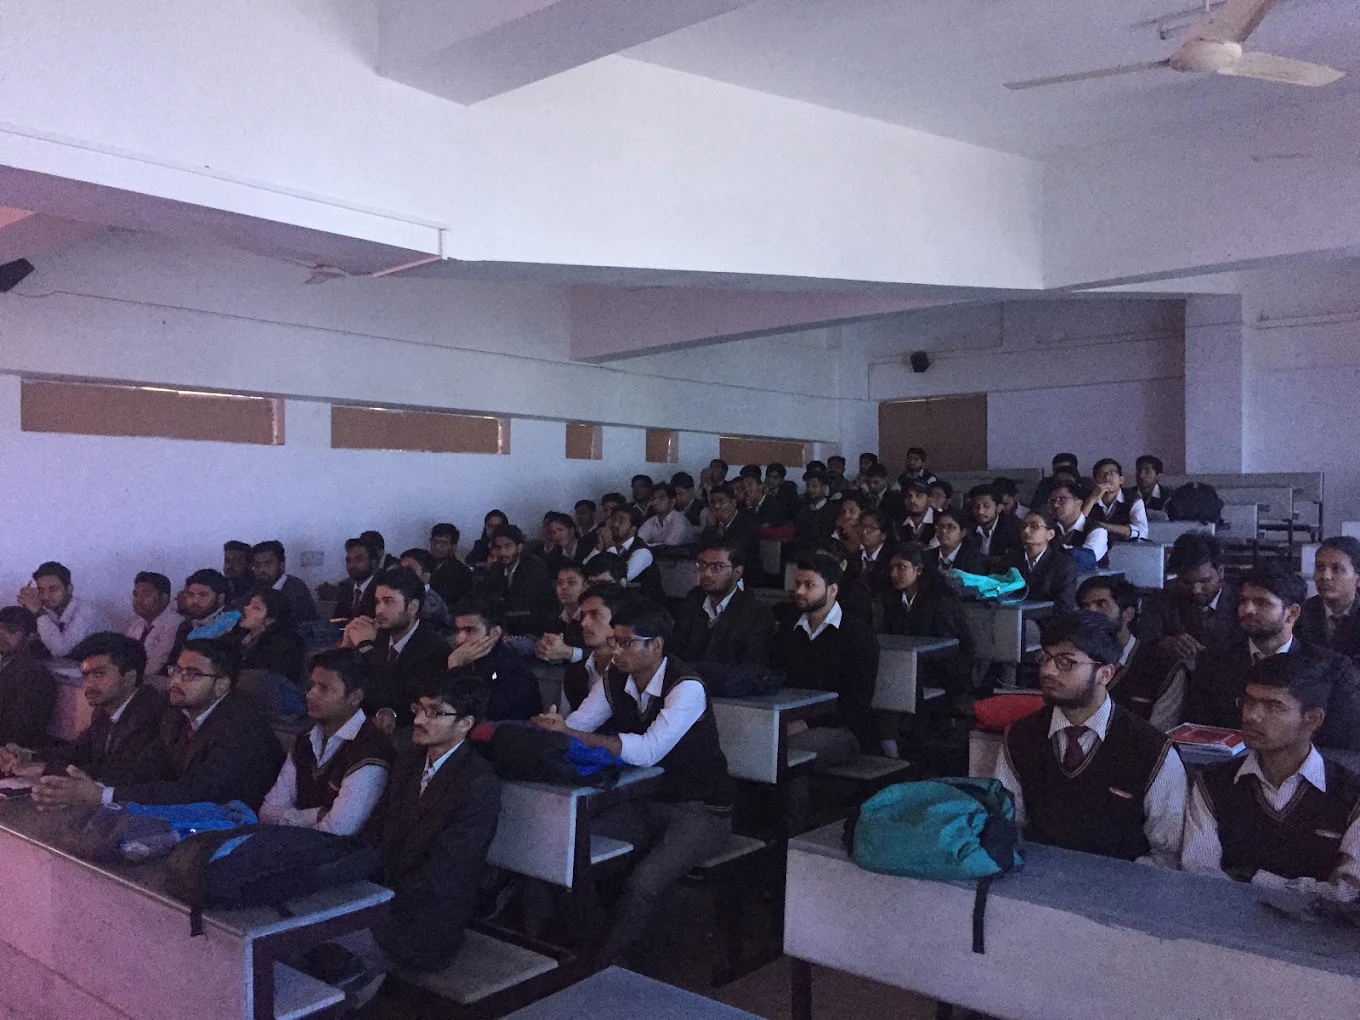
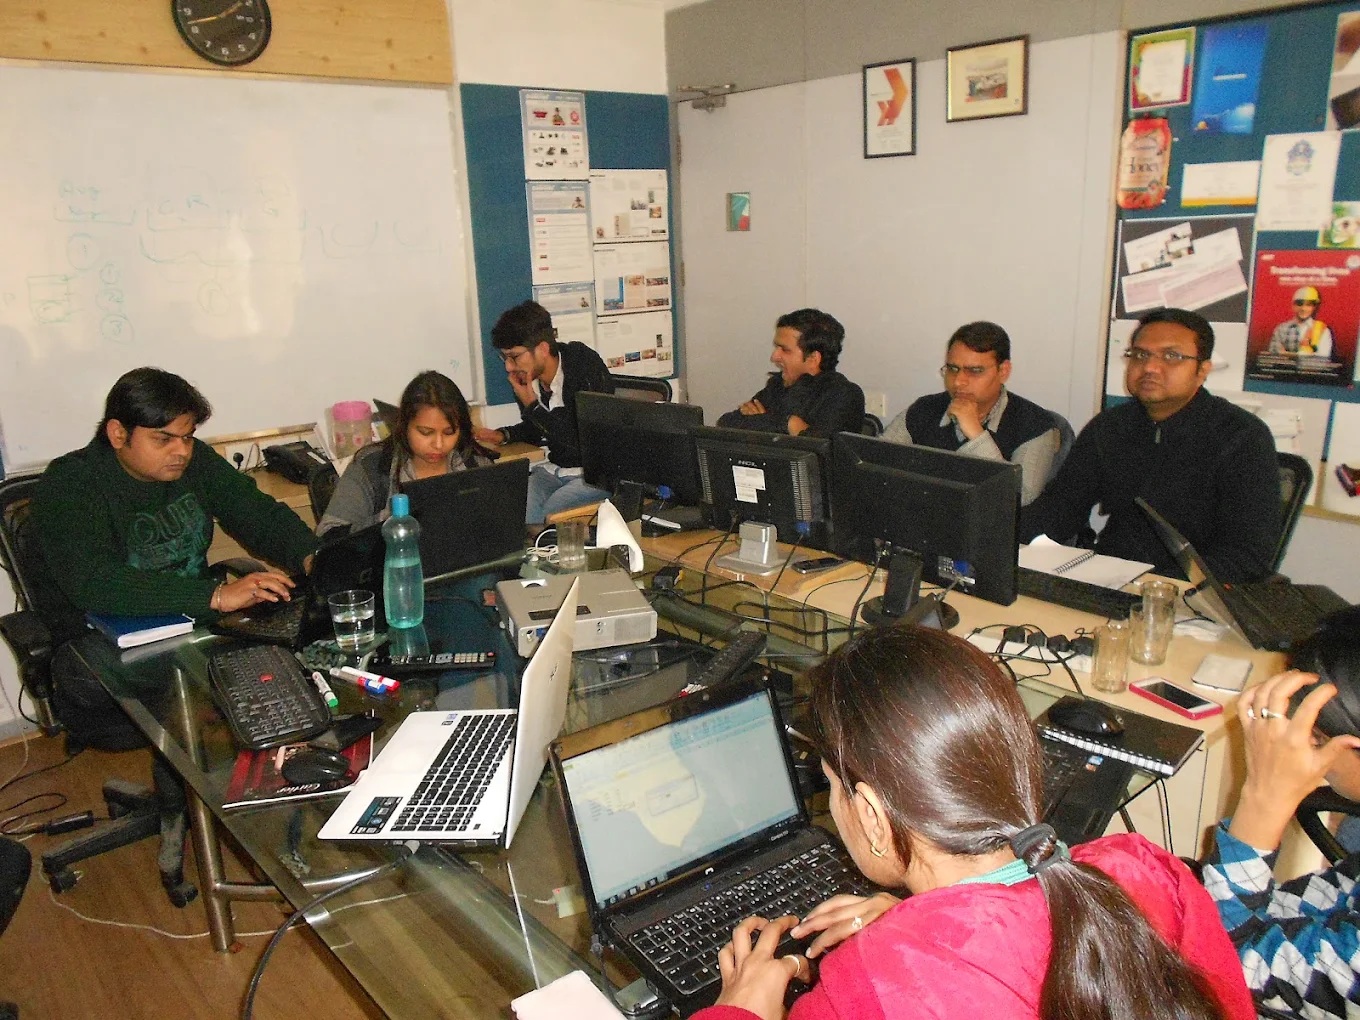
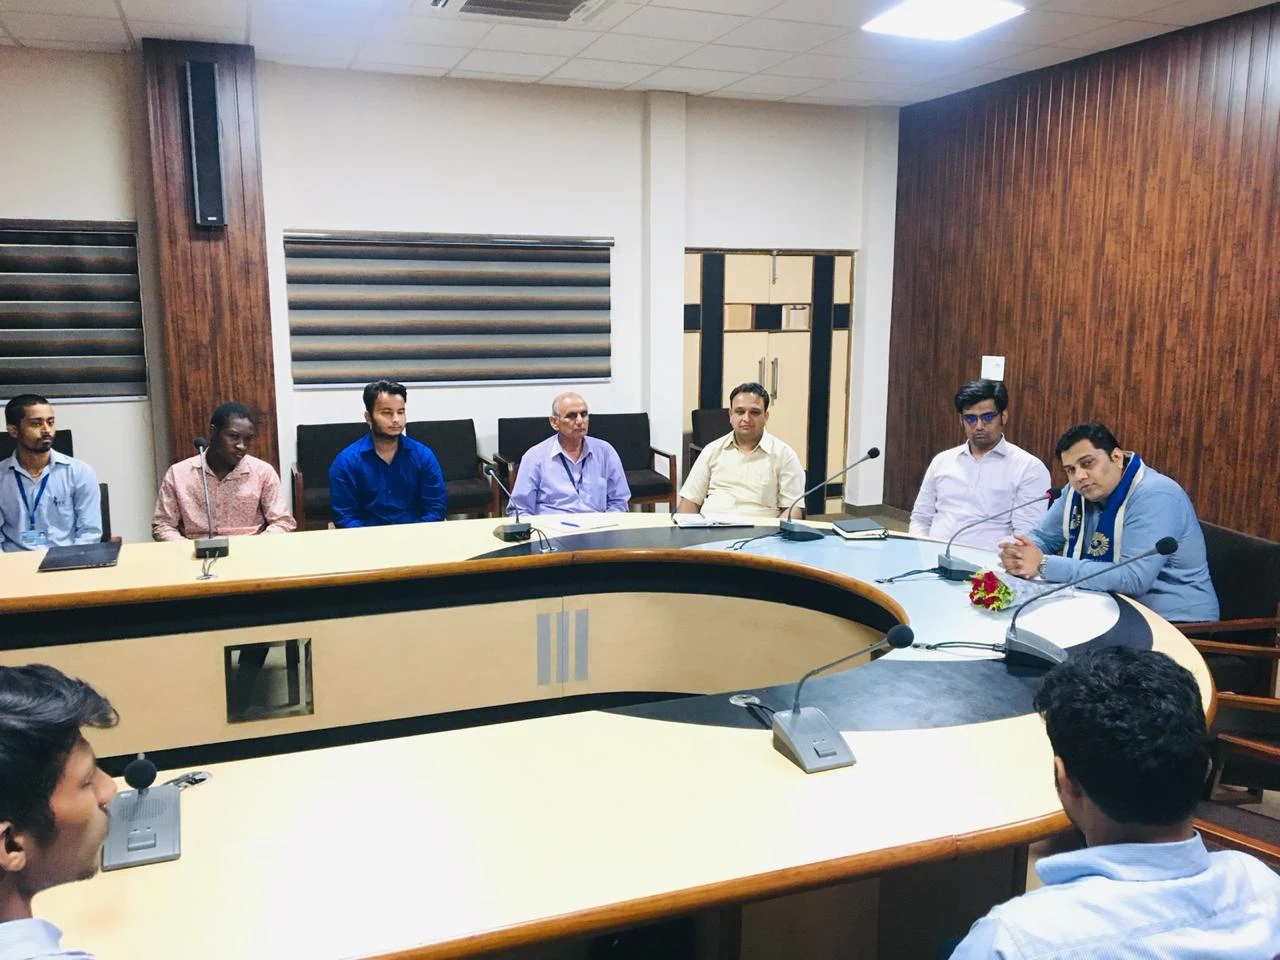
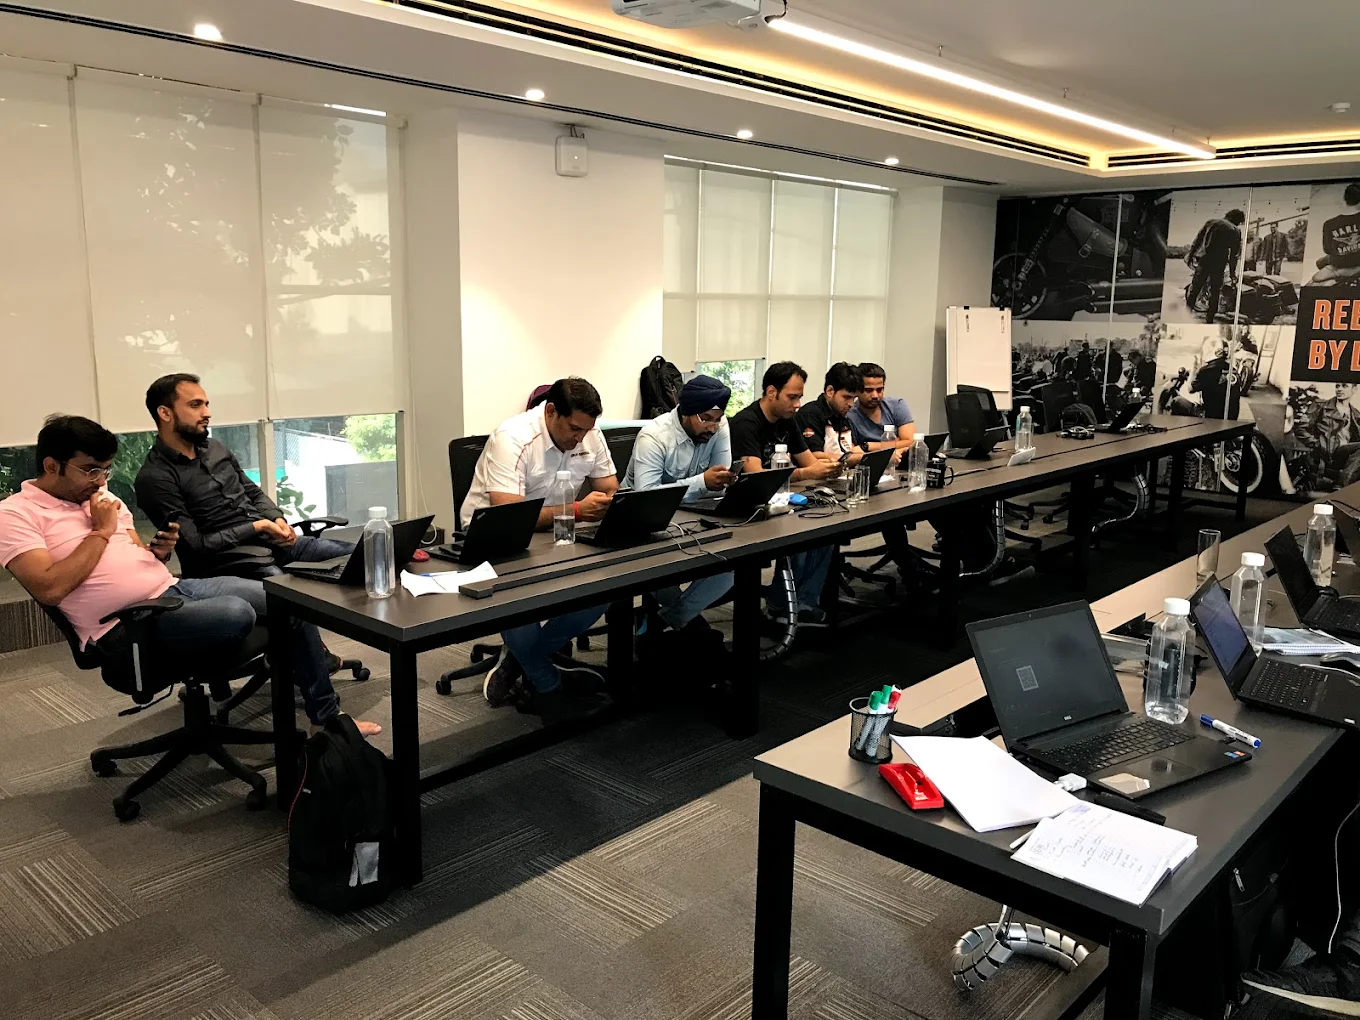
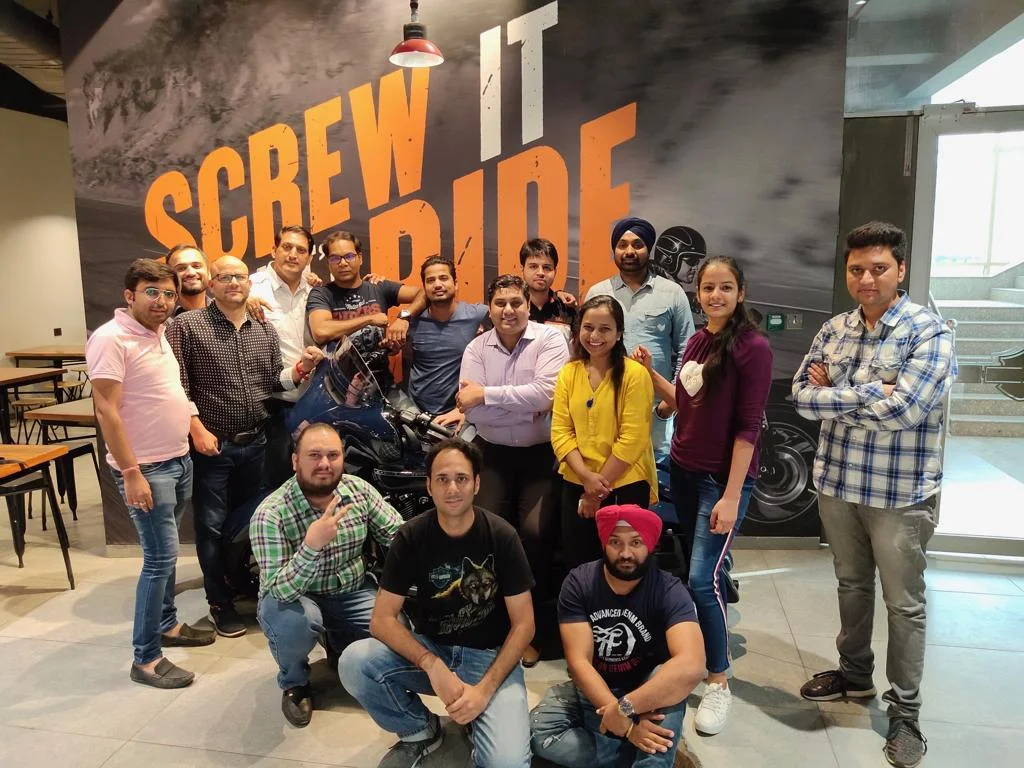
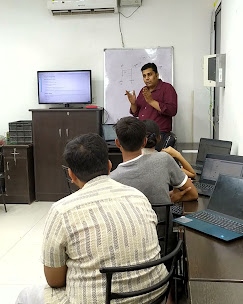
Real training photos
These are real photos you shared for Seldom India. They make the page feel more credible because visitors can see actual sessions, group activity and classroom-style training instead of generic ad creatives.
Resume support, interview preparation, project guidance and profile improvement. This is assistance and preparation support, not a guaranteed job offer.
Ask for certificate and completion details during counselling so the team can confirm the latest process for your batch.
B-33, Basant Vihar Colony, Gopalpura Bypass, Tonk Rd, above Brown Sugar, Gopalpura Mode, Jaipur, Rajasthan 302018.
Helpful resources
Your blog, project and workshop pages are useful supporting assets. They help visitors explore practical work before they enquire, and they can also strengthen SEO when linked carefully.
Browse practical builds and coding examples that support the hands-on positioning of this course.
Keep useful learning articles live and connect relevant ones back to this Data Analytics page.
Workshop and certificate content can continue supporting trust as long as it stays organized and relevant.
FAQs
Yes. The course starts with Excel and analytics basics before moving into SQL, Power BI and Python.
Yes, the main focus is offline classroom training in Jaipur. Online support is also available.
Yes. Power BI dashboard creation, Power Query, DAX basics and reporting practice are included.
Yes. Seldom India provides 100% job assistance through resume, interview, project and profile guidance.
Submit the form or call +919001827800. Fees and batch timing can change, so the counselling team should confirm the latest details.
A laptop is recommended for practice. The team can guide you if you are unsure about system requirements.
Speak with Seldom India before enrolling and confirm the right batch for your background and schedule.